
One of the most common questions I get asked is: “What do you think of the idea of trashing timesheets?” My standard answer is: “It might be a great initiative for your firm if it is a catalyst for creating a client value centric business model but some form of time monitoring does provide useful management information.”
There are some very sound arguments for trashing timesheets. There are also some flawed (as in no substantive empirical evidence to support the assertion) arguments for doing so. It’s not my intention to open that debate here but for present purposes I would like to make my position on the use of timesheets abundantly clear.
First, I don’t believe they should be used as a basis for assessing team member productivity although while I accept a case can be made for this I believe there are far better ways to do that which are more likely to result in an improvement in productivity, an improvement in morale and an improvement in client value creation. In an earlier post I discussed this issue among others.
Second, I don’t believe that they should be used for pricing purposes but I accept that a case can be made for this on several grounds e.g. it is easy and, more importantly, if you want to settle on an hourly charge rate as the basis for being compensated for your time and talent then so be it – in our society you have the freedom to choose how you price your services. Some people argue that time-based pricing is unethical which, quite frankly, I think is an absurd generalization that is without empirical evidence to substantiate. You might like to refer to an earlier post in which I discussed this point and in another post I commented on that suggestion.
Having made these two points I would like to talk to the question of whether timesheets have a role to play in the financial management of a professional service firm.
In a previous post titled Are All Your Clients Profitable To Service I suggested that timesheets should not be used for pricing purposes but I stopped short of suggesting they should be discontinued. Instead, I made a case for populating the “cost” field in time and billing software with the full direct cost of the person(s) working on a job rather than a billing rate for that person(s). In that post I outlined the theoretical framework that I based this suggestion on and described a software application you could use to make important management judgments relating to client selection, retention, process efficiency and resource allocation.
I happen to believe that because value is a subjective concept it makes sense to seek to understand the value your client perceives from the work you can do for her. Often you’ll find the client places a higher value on your work than other clients in which case you will incur an opportunity cost if you use a standard (and presumably lower in this case) price.
We also know that recurring criticisms clients recite include “I’m always surprised by the fee” – meaning it’s always higher, and “how do I know you are working efficiently?” These issues go away if you discuss the scope of the project and the fee with your client before you start work. This is not a trivial process and for specific advice on how to conduct a “value meeting” I refer you to Ron Baker’s book Implementing Value Pricing and also to The Portal Resources for The Disrupters Conference at which Baker and I spoke about the need to rethink and re-engineer the traditional accounting practice business model.
However, there are two sides of a transaction. It’s fine to be addressing the value a client perceives from a service but as a business manager you need to look at the other side of the coin. Your cost structure will determine how much of the value you have created you are able to capture. After all, the purpose of a business is to create value for its stakeholders which include, customers, team members and owners.
I believe prudent financial management involves, among other things, an understanding of the cost of resources used in producing a firms output.
There are two reasons for this. First, if an assignment takes longer than you originally expected you need to identify why that has happened and determine if your systems are at fault, your client is at fault, and/or your team member(s) is at fault so that you can fix the problem and/or adjust your pricing for future. Often scope creep expands the magnitude of a project so it may also be necessary to open a dialog with your client as provided for in the change orders that you should have referenced when the project scope was initially documented. Now, I you don’t need to be using time sheets to deal with these issues if you have an appropriate workflow management system in place and team members understand the work plan.
The second, and more compelling reason for using timesheets is to enable you to assess the profitability (to your firm) of your various clients and you can’t do this by simply looking at the fee revenue they represent. This may be likened to a retailer knowing the profitability of her product lines or a contractor knowing the profit on a construction project. As an accountant you know better than most that profit is the difference between revenue and expense. You will also know that an accounting firm’s expenses will include labor expenses (and related on-costs) together with other operating expenses.
You also know that any given portfolio of products, services, and/or clients will yield different levels of profitability. If you accept the argument that superior performance comes from both the effective and efficient utilization of resources it stands to reason that you need to have feedback information that talks to those two issues.
In an earlier post in which I talked about doing a client profitability analysis I suggested that by using timesheets you could build a reasonable accurate activity-based estimate of the cost of resources used to generate revenue from each of your clients. This would consist of the fully-burdened cost of direct labor plus an allocation of other firm expenses using an allocation rate based on direct labor hours.
With that information you are able to determine each clients’ contribution to overall firm profitability and when you sort your clients from highest to lowest and plot the cumulative profitability of your entire client base you end up with a curve that looks like the one in Figure 1 below which is sometimes called a whale curve for obvious reasons. If you have a firm that does just one type of job for one type of client with a standard set of resources (H&R Block business model) your cumulative profitability curve will head north east as a “close-to” straight line. But for the vast majority of accounting practices it will assume the shape of a whale. This software tool is available from The Disrupters Portal I referred to earlier.
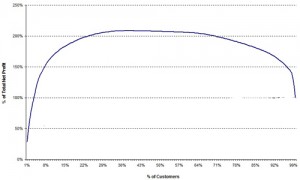
Typically we see 20-40% of clients contributing well in excess of 100% of a firm’s final net profit. At that point the cumulative profitability curve flattens out. Typically it stays flat for the next 20-40% (meaning that you are just breaking even on those clients) and then the last 15-20% of clients drive the graph down to your final net profit.
As a management tool this is very important information because it gives rise to several questions all of which relate to THE most important cost concept in management decision-making – opportunity cost:
They include:
(1) Which of the clients located to the right of the profit high point are likely to be significant profit contributors in the future?
(2) Are we allocating the right resources (people) to this work?
(3) Are our systems letting us down in this area of our practice?
(4) Should we be re-pricing the jobs we’re doing for these clients?
(5) Is there an appropriate fit between our core competencies and the work these clients expect or need us to perform?
(6) Of the clients that we are losing money on, which of them are likely to become profitable in the future?
(7) Of the relatively small number of clients who are the major contributors to our profitability how many of them are likely to remain clients for the foreseeable future?
(8) What is the profile of our most profitable clients, what resources do they require and what are we doing to market to this client avatar and/or help our “break-even” clients move into that premium client category?
These are very important management questions that need to be asked and your practice management information system should be prompting you with metrics of the type I’m proposing here. When time and billing systems are used exclusively for billing purposes these questions are not being asked and the analysis of client profitability is not being done; in part because the “cost” used in the system is the charge rate not the fully burdened cost of labor. As a consequence the “most profitable” clients are thought to be the largest revenue generators. This is often the case but it may not be and even though they may be yielding the highest absolute contribution to profit they may be very ordinary at the margin.
I have shared these thoughts with some of my colleagues who advocate trashing of timesheets for all the good reasons. As an alternative to using time for allocating firm expenses just allocate them using revenue. In my opinion this is a 70 year backward step in costing theory but more importantly, it results in a cumulative profit graph that simply heads north east because all clients will be “profitable” which in effect means the more profitable clients are actually “subsidizing” in the analysis the less profitable ones. Refer to Figure 2 below – the broken line represents the cumulative profitability curve where total expenses are allocated by the ratio of a client’s fee to total revenue.
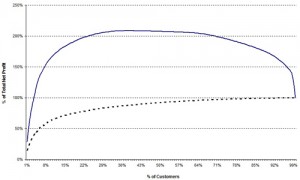
The use of revenue as a basis for expense allocation does not lend itself to making decisions in relation to the questions I have posed above. In fact I would suggest it doesn’t tell us much at all and because of the “subsidizing” effect I submit it may be dangerous. Because the curve will always be asymptotic to the 100% net profit line it will never reveal the profit that you may be leaving on the table.
In my opining there is far too much attention given to revenue and revenue growth in all businesses and nowhere near enough attention given to where profit (read value) is actually being created and captured. Implied in this mindset is the idea that all clients are profitable as long as the charge rate is set as some multiple (usually 3-4) of salaries and wages. This explains why the majority of firms exhibit a narrow band of profitability and why more than half the firms in the industry are yielding a net profit per partner that is below the average for the industry as a whole. For a detailed analysis of accounting firm profit drivers see my eBook titled The Performance Characteristics of Accounting Firms That Are Sending Their Owners Home with at Least $1 million.
Jack Welch created billions of dollars of customer, team member and shareholder value by applying a simple management principle (which I believe was exposed to him by Peter Drucker) and that was to be number 1 or 2 in your industry otherwise fix, sell or close the business. This would be good advice for any business to follow including an accounting practice but the key is to know what clients (or team members or systems) to fix, sell or close.