
They–the nameless and faceless people who make predictions about everything from the weather to the stock market–say it costs 6 times more to acquire a customer than it does to retain an existing customer. Interestingly, the literature contains references to acquisition to retention cost ratios ranging from 3:1 to 30:1. Quite frankly, I don’t know if the 6:1 metric is an urban myth or a thoroughly researched observation but I do believe we can safely say that many companies, if not most, spend a lot on acquisition and, in all probability (I base this conclusion on my personal experience as a customer), a lot less on customer retention.
For an interesting discussion on this see a blog post from a LinkedIn post Ian Kingwill click here and for an even more interesting InfoGraphic from Invespcro, a web marketing support company (www.invespcro.com) click here.
The Invespcro InfoGraphic suggests the following (again, I have no idea with what authority):
- 44% of companies have a greater focus on acquisition versus 18% that focus on retention
- 75% of companies see customer lifetime value (CLV) as an important concept for their organization
- Only 42% of companies are able to measure CLV accurately
- The probability of selling to an existing customer is 60-70%, while the probability of selling to a new prospect is 5-20%
- Existing customers are 50% more likely to try new products and spend 31% more when compared to new customers
- Increasing customer retention rates by 5% increases profits by 25-95%
Given these “facts” it seems we should give at least some attention to a process for measuring the lifetime value of a customer (CLV) because if that value is less than the cost of acquisition there is only one direction for a business to head. Furthermore, if we have at least a somewhat reliable estimate of this measure we can make judgments on such things as:
- Customer targeting and selection criteria
- The design and development of products and services
- The design of an appropriate pricing model
- Marketing strategy and budgets
- Salesperson compensation planning
- Operational initiatives relating to customer service, support, team training, and revenue management
- Determining the “value” of a businesses’ customer base
- And probably a bunch of other things I haven’t thought of
I could go even further and rely on the authority of the late, legendry Peter Drucker who argued that the whole purpose of a business is to create and retain a customer and that the only two profit centers in an organization are innovation and marketing, all the rest, he said are cost centers.
So while a good case can be made for the systematic measurement of the lifetime value of a customer it is not a trivial exercise. There are clearly three principal things that drive the value estimate and they are: how long the customer remains a customer of the firm, the average customer annual spend, and the cost of products and/or services provided to the customer.
However, it is hard enough to assign a value to these things but there are several other aspects of a customer relationship that have value implications and which are even more difficult to measure. These include a customer’s referral activity (quantity and quality), and intangibles such as the impact a customer’s service needs may have on your firm’s IP development together with the professional skill growth of team members who work on the customer’s assignments and the firm’s IP, or the branding cachet your firm may enjoy from working with certain marque clients.
These challenges notwithstanding I have cobbled together a methodology that you might be able to use in your own firm as well as with your clients. The figure below is a printout for an accounting firm that has an average gross margin of 65% (i.e. net fee revenue less the direct cost of labor and any other direct costs) and an average initial fee of $2,500 for a new client – this initial fee assumption is not important because my model simply determines a CLV multiple that you can apply to whatever average revenue you choose.
I have used a standard formula to calculate the present value of an increasing annuity given an assumed growth rate and an assumed discount rate. The actual formula is shown in the spreadsheet I built to do the calculations. Click on this link if you would like to download a copy.
The average lifetime (longevity) of a client in this illustration is based on information I got from the CCH Report, Improving Retention through Better Client Connections (page 15.) This report is free and is available by clicking here. This report is well worth reading even if you have no interest in the CLV calculation methodology I have developed. Based on the assumptions shown in the report summary below, these client tenure assumptions yield an average lifetime of about 8 years and a client retention rate of 87%. My guess is, this is pretty close to the mark for most established firms.
Table 1
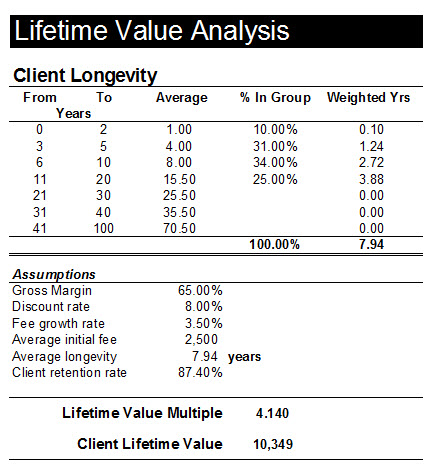
Based on the assumptions shown the Lifetime Value Multiple is 4.140 which, based on the initial fee assumption yields a CLV of $10,349. If this firm had say, a 250 client portfolio, the gross value of its client base using this methodology would be $2.587 million. But remember, this is a gross value based solely on the gross margin. If the firm’s operating overheads (before owner compensation) represented say 30% of revenue the estimated value would be $890,000. It’s important to note these value judgments represent the value of the client base to the firm, not the value of the firm. In a later post I’ll address the question of how the the CLV can be used in valuing the firm.
The second sheet in this workbook shows the calculations of the value for each of the years that the “average” customer is a client. To make it easy I have rounded the lifetime period so there will be a corresponding rounding error but the calculated CLV will be close on both sheets.
Table 2
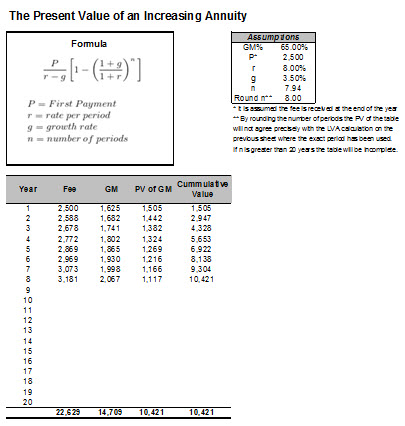
In addition to validating the methodology, the table shows what the cumulative gross value of a new client would be over time so, for example, if you estimated that it cost you $3,000 on average to acquire a new client you’d have to want this client to stay with your firm for at least 3 years. This is one of the reasons why my recommended client selection criteria for business development clients stipulates, among 10 other criteria, that the prospective client has been in business for at least 3 years because the probability of that business surviving for at least 5 years is significantly higher than is the case for a start-up. In fact you get way better odds playing roulette than an “average” startup client offers.
Clearly, a few caveats are in order here. This is a high-level methodology in that not all clients are “born equal.” When used to calculate the CLV for an “average” client you need to be aware that there is no such thing as an “average” client. However, the methodology does give you some insights into the structure of your client base and it would be particularly useful if you were to split your data set into a couple groups and run the application for each one separately.
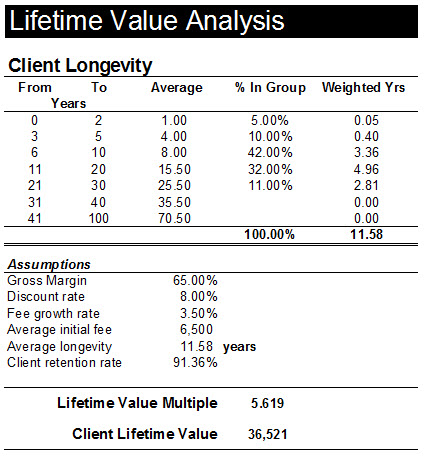
For example, Table 3 below might be for a group of your “bigger and better” clients who have an average fee now of say $6,500 and longevity data as shown in the table. For the sake of illustration, let’s further assume there are 50 of these (leaving 200 remaining clients following from my previous assumption.) The CLV for this group of clients is now estimated to be $36,500 compared to the Firm-wide average CLV of $10,350 as previously calculated.
Table 3
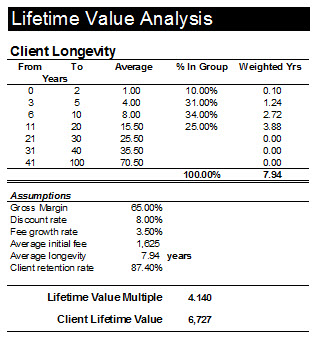
But now we need to recast the numbers for the 200 other clients to reflect the fact that $325,000 of current revenue is now accounted for by the 50 bigger clients. This leaves revenue of $300,000 for the remaining group or $1,625 per client. The lifetime value analysis for that group is shown below and notice that I reverted back to the longevity percentages for this group on the assumption that they were representative of that group in the firm’s client base.
Table 4
The calculated CLV for the two groups of clients illustrates the dramatic difference in value over their respective estimated lifetime—there is a $30,000 difference between the present value of their gross margin streams and my gut tells me the value contribution is even higher when you consider the intangible value contribution the bigger clients bring to the table. Being aware of this is useful when planning your client acquisition and nurturing strategy and at the end of the day it can mean the difference between building an outrageously profitable and valuable firm and a mediocre one.