
I recently had cause to check out a bank website that was promoting lending services for small businesses. It is probably a great lending institution but its attempt to explain a P&L statement is patently wrong …. In my view.

The bank’s post presents a P&L as shown above. It indicates that Gross Profit (they call it Gross Margin which is OK but technically incorrect as GM is a % expression not an absolute) is equal to Revenue less Direct Costs which they claim to be all “variable” costs. Amortization charges are definitely NOT variable costs and have no place in a Gross Profit calculation. Furthermore, unless Labour costs based on a piece-work formula i.e. vary in direct proportion to revenue, they have no place there either. They are a Direct Fixed cost.
This P&L should have been presented as follows:
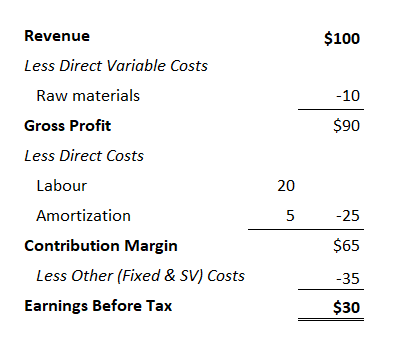
You might reasonably say what’s the big deal, you get to the same bottom line! True, but if you plan to do any further analysis of this report such as calculate a break even revenue estimate you get a total different result if you apply a textbook formula being Fixed Costs/GM%. The fact is, the bottom line is the result of transactions, it is a consequence, what’s really important is what gave rise to the reported bottom line. That’s the stuff that sensible review decisions should be based on.
Based on the bank’s presentation, the break-even calculation would be $54 ($35/65%). Based on the correct (in my view) definition of cost variability, it would be $67 ($60/90%) which is 24% higher. I would argue that’s a material difference. If you do the calculations, the business would loose $11.40 on revenue of $54.
My practise when presenting financial statements to clients is to show only TRULY variable costs as part of COGS – typically raw materials, packaging, variable supplies etc. That would be the basis for my Product Gross Profit number.
Below that line I would place revenue-based variable sales commissions and any other direct variable selling expenses to show the Enterprise Gross Profit which is the basis for calculating a realistic Gross Margin %. This is the GM I would use to estimate a break-even revenue and related estimates such as Margin of Safety and Profit based Revenue targets.
In the preparation of the final P&L I would Identify, and list by line item, the expenses which are contractually or managerially fixed for the period concerned. These are the costs that will be incurred whether there’s a $1 of revenue or not. I would then classify all the remaining expenses as Activity Based expenses. These are all the semi-variable expenses that are associated with the day to day activities of the business. For practical purposes I lump together Fixed and Activity Based Expenses to estimate break-even.
One final point. Instead of using a heading like “Less Expenses” in the P&L I would use the phrase “Less the cost of resources used to produce your contribution margin.” This is not technically correct because such a statement should include the costs reflected in the contribution margin as well but it serves to start a conversation with my clients about the role all expenses play in creating value for customers. This happens by going through each line item and asking the following questions:
- How does this resource/service contribute to creating value for our customers directly or indirectly?
- Should we invest more or less in this resource or service?
- Is there a better way, or more cost-effective, way to create the value this resource or service currently provides?
The framework I use will probably not be found in too many accounting or financial textbooks (if any) but I can assure you that the way you present a set of financial statements plays a huge role in the quality of conversations you will have with your clients and it is these conversation that create not only important operational insights but help your client better understand the nature and significance of financial reports and therefore the value they serve as management tools.