
As I have discussed in a previous blog posting, time and billing systems that are in general use masquerade as practice management systems but even those that have the potential to provide useful management information are not generally used for that purpose. The only “management” support they give is to monitor time charged by people for billing purposes.
Ideally, a costing system for a service firm should be able to provide management with information relating to the profitability of different customers and different products or services. It should also be able to be tied back to the firm’s budgeting system and I would expect it to be able to be used in pricing decisions and for determining whether to accept or reject engagements etc. I have yet to discover a time-based “practice management” system that does more than price jobs. If you know of one please tell me and I’ll do what I can to promote it to the world.
No matter what pricing methodology you decide to adopt you would be wise to know your costs. That statement almost sounds trivial and yet I have come across very few people in professional service firms (PFS) who actually know their costs or show any real interest in them for that matter. They are taken as a given because, at least in the short term, most costs are fixed and the gross margin is generally so high that any revenue is assumed to contribute something to the bottom line.
Your firm’s P&L will obviously tell you whether the aggregate of your revenues exceeds the aggregate of your expenses but it tells you practically nothing else of any significance. It’s a little like using a thermometer as the sole indicator of your current state of health.
Now let’s take this further. Your so-called “time costing” system will tell you what time went into producing your revenue, it will even tell you whose time it was and you’ll get a crude idea of what work was done for each of your clients. However, for the most part, the “cost” attached to the “hours” will be the cost from the client’s perspective. That is, the targeted charge rate for the time allocated to the task. This is quite different to the cost of resources used by the firm to service its customers and therefore you will not know how profitable that work was. This is why the vast majority of PSFs are harboring unprofitable customers without even knowing it.
If the cost of resources utilized to service a client is greater than the revenue generated then, unless there is a reasonably clear expectation of a future profit stream i.e potentially high lifetime value, it makes sense to implement one or a combination of the following strategies: (1) increase the price of the service, (2) re-allocate lower cost resources to the work process, (3) reduce the cost of resources used through negotiation with suppliers, (4) seek to improve productivity of the work process, and/or (5) cease to service that client and redeploy the resources that are released to more profitable work.
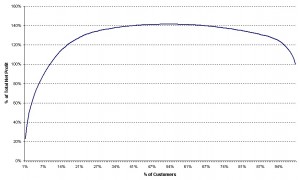
If the published research conducted by people such as Fred Reichheld (Loyalty Effect guy) and Bob Kaplan (Balanced Scorecard guy) is any guide, the cost of unprofitable customers is likely to be very high in PSFs. For example, the following graph relating to an insurance business is from an article written by Bob Kaplan that was published in the Balanced Scorecard Report (August, 2005) called “Add a Customer Profitability Metric to Your Balanced Scorecard”.

Commenting on the graph, Kaplan notes:
The shape of the curve occurs in virtually every customer profitability study ever done, (emphasis added) in which 15 percent to 20 percent of the customers generate 100 percent (or more) of the profits. In this case, the most profitable 40 percent of customers generate 130 percent of annual profits; the middle 55 percent of customers break even, and the least profitable 5 percent of customers incur losses equal to 30 percent of annual profits. With its most profitable customers, the company worked harder to ensure their continued loyalty and to generate more business from them. For customers in the middle break-even group, it would improve its processes to lower its cost of serving them. It focused most of its attention on the 5 percent-loss customers, taking actions to re-price services and asking them for more business in higher-margin product lines. If the company could not transform these customers into profitable ones by these actions, it was prepared to drop the accounts.
My research confirms that Kaplan’s findings seem to be replicated in accounting firms. With the cooperation of several members of the Principa Alliance I have generated a client profitability graph for their firms. The diagram shown below is for one of those firms (a sole practitioner) and reflects the pattern that is typical for all the firms I analyzed. For this particular firm, 141% of its final net profit is generated from 53% of its clients. The next 30% are approximately at break-even and the last 20% of clients “cost” the firm about 41% of its potential profit while utilizing 45% of its capacity. Applying the Pareto Principle, 80% of the firm’s maximum profit potential is generated from 14% of its clients!
Before turning our attention to the loss makers, let’s talk about the ones at break-even. This is an interesting group and may represent 40-50% of your clients. Some of these clients will be your stars of tomorrow so they’re not candidates for firing. However, the fact that they are break-even suggests that you should at least look at the effectiveness of the process you are using to service them, the services they are buying and especially the pricing of those services.
Now to the loss-makers. Other things being equal, if you fire the bottom 20% of your clients the costs that they are now absorbing would need to be absorbed by the remaining clients so you’ll end up with another group of loss-makers and so on. This is the rationale that most people use to justify keeping these loss-makers on their books. However, I will strenuously argue that is NOT usually the smart thing to do. Here’s why. …
The clients I’m referring to are, for the most part, the most difficult to serve, they are the 20% who contribute to 80% of your challenges, they are probably small, have high write-offs, they only require low level services, they are uncooperative or your service protocols are not well suited to them. In short, they are not a good fit for your firm but may be a great fit for a different firm. Of course, some of this group may be new clients with strong potential who you see as being solid in the medium to long term in which case you’ll want to hold on to them and develop the relationship.
What is important is that the clients in this group are certainly consuming resources that could be better deployed if you could find more “better” clients and as long as you’re allocating capacity to them you will not have time to look for and attract “better” clients. With the exception of the high potential group I previously mentioned, the gutsy strategy is to refer them to a firm that is better suited to their needs and then go out and replace them with better quality clients. Based on my experience this is the fastest way to improve the quality of your client base and I never cease to be amazed at how easy it is to implement. My colleague and friend Ron Baker tells me that’s been his observation as well.
The less courageous, but nonetheless very sensible, strategy is to replace lower level revenue with higher quality revenue as it comes in. That is, suppose, you sign up a new client with a revenue estimate of say $10,000. You then go to your unprofitable group and remove $10,000 worth of clients. That way you preserve your immediate revenue, increase your immediate profit and better position yourself for profit growth from that better quality client than was likely to be the case with the ones you got rid of.
You may be thinking “wait there, the people I have working on the low level clients will not be able to do the higher level work our new client requires.” If this is in your mind then you’ve just fallen into a huge but common practice development trap. The keys to developing a robust, profitable practice are to be found in client selection, service line offering (hence your pricing options), people development and delegation (hence your productive capacity leverage.) It makes no sense at all to be looking for higher quality clients if you are not simultaneously creating higher quality team members and offering higher quality services. You will not develop (or keep) high quality people by giving them low quality, less challenging work to do.
I have also heard the argument that “we know some of our clients are not profitable and on a full costing basis, may even be unprofitable but we accept this on the grounds that some of these clients will blossom in the fullness of time.” This is the “oak trees out of acorns grow” argument. I don’t have an issue with this argument but I wonder if you should have 40-50% (and in some firms more!) of your clients in the “acorn” category or, more to the point, are you aware that this is in fact the case for many firms?
A healthy cumulative profit curve would be one that rapidly increased to say 80% of your final net profit (probably from 20-30% of your clients and 30-40% of your available capacity) and then steadily increased for the remaining 20% of your net profit. This would be in keeping with Pareto’s Law — which, in my view, seems to be a natural law of business and it would reflect the fact that not all activities undertaken in a firm yield the same level of profit. It would also serve the purpose of keeping attention on the return that the firm is getting from a very large proportion of its available capacity and in the process, remind management of the need to continually monitor not only value created by value captured.
A Simple Costing Model
The profit contribution graph illustrated above is a useful framework for analyzing the contribution clients make to a firm’s overall profitability. Even in cases where there is no decline in the graph it will highlight what percentage of clients account for 80-90% of a firm’s profit. This in turn raises the question of whether resources consumed in servicing the remainder of clients might be better deployed or, as Kaplan suggests, it indicates there is a need to improve your processes to reduce the cost of servicing these clients.
How long something takes to complete does not reflect what it is worth to a customer. However, time is one of the major drivers of what it costs to provide the service and is therefore relevant from the perspective of the producer of the service. The rationale for this is simple, if you are paying a knowledge worker say $30 per hour and that person takes 1 hour to complete a task, part of the cost of that task is $30 – this is payment for the intellectual capital provided to the firm by that team member.
In addition, the knowledge worker will utilize other resources that are provided by the firm to its knowledge workers e.g. application software, telecoms, paper, utilities, postage, internet access, library resources, office real estate etc. Some of these resources are fixed costs and others are variable but they are an expense incurred by the firm and to determine the profit associated with the work done for clients they should be charged to that work in some way. In a perfect world, we might use an activity based costing methodology to assign all of these costs. However, we don’t work in a perfect world so we need to use an alternative simple approach.
I believe that the amount of time involved with each client is a good basis for determining the total cost. To accomplish that it is obviously necessary to use timesheets. I have built a spreadsheet costing model that determines client profitability in the following way:
Step 1: The total expense of the firm is determined. Fully burdened labor costs are separated from other expenses. If owners are not paid a salary an imputed cost for owner salaries is determined and is reflected in the total labor cost – this will include both direct labor (i.e. people who work on client engagements) and indirect labor (i.e. support people.)
Step 2: An estimate is made of the firm’s chargeable capacity. We start with an estimate of the number of hours that would be available in a standard work year by an effective full-time team member after allowing for annual vacation, public holidays, sick leave, training time and “other” time not available for client engagements. We’ll call this available capacity for a client-facing team member.

Step 3: Not all available direct labor capacity can be expected to be engaged in client work. For example, people need to attend meeting’s, they are involved in training, selling, general administration and a wide range of other activities associated with a normal accounting business. Some people may refer to these activities as being non-productive but that is far from the truth. They are an essential part of the business of accounting so there is little point pretending that all available time is potentially chargeable time. For costing purposes we use an average firm-wide estimate of the percentage of chargeable time that the firm targets and we apply that to the total available capacity for all of the people in the firm who are engaged in chargeable work. We’ll call this the firm’s Practical Attainable Capacity (PAC). See the pop-up form used in the software to calculate this.
Step 4: We calculate an indirect charge per hour by dividing total non-labor expenses by PAC. This is an hourly cost that we suggest should be added to the firm’s costing system so that the “cost” of a job will show separately, the fully burdened labor component and the indirect expense charge based on the number of hours. When this is done the person responsible for billing can immediately see the cost of resources used. If it is the firm’s policy to use cost-based pricing it will simply be a matter of applying a mark-up factor. Alternatively, it may already have a fixed price agreement in place (or a value price in mind) in which case this information will enable it to review the profitability of the engagement and if necessary, revisit its work processes or its pricing next year based on this cost information.
Step 5: It is quite usual for a single client to be associated with several costing entities e.g. a company, trust, personal tax returns, audit, company secretarial services etc etc. To determine overall client profitability, these need to be aggregated and placed in a spreadsheet that contains the information below shown below. It is then imported into the costing model:
Client entity name
Total gross revenue
Write-(offs)/ons – if applicable
Total hours involved from all team members
Direct labor cost for all team members (including owner imputation if necessary)
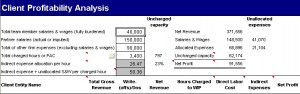
Step 6: Once the data is entered, we simply click the analyze button and the estimated net profit for each client is determined and the client entities are sorted from highest net profit to lowest and the cumulative profit graph and calculations are performed. An on-screen report pops up to deliver the verdict.

Timesheets, Profitability Analysis and Productivity Monitoring
This costing model requires the use of timesheets that some people consider to be not only a waste of time but, they argue, also negatively impact the firm. I don’t want to engage in this debate here other than to say that in my opinion time sheets used for service pricing are not only a waste of time and effort but have been a major reason why the profession has experienced a real income-per-partner decline of approximately 1% over the past 30 years despite being handed unbelievable commercial opportunities and access to amazing productivity-enhancing technologies during that time. I refer to this as a Productivity Paradox and have addressed this in an earlier post in November, 2009.
Having said that, if timesheets are used for resource costing purposes as describe here they will provide useful management information. I have heard of one consultant to the profession who has suggested that timesheets be used to monitor “productivity” but not for pricing and his recommendation was (is) to carry the “cost” at $1 per hour to effectively force a pricing strategy based on value or whatever he had in mind. That doesn’t make much sense in that if you are already collecting data relating to time spent why not tie it to the direct labor cost and indirect enterprise costs so that you can get a comprehensive profitability picture to review. The “productivity” metric implied by his advice is irrelevant I believe – what’s the point having high levels of productivity on clients you are losing money on? That’s like traveling faster in the wrong direction–you get nowhere quicker.
On reflection, the traditional concept of productivity being measured by the ratio of hours charged to hours available certainly tells us something about activity but very little about results. In fact it doesn’t even tell us much about productive efficiency it just tells us how much time a person entered on a time sheet–the idea that the more time a person puts on the time sheet the more productive that person is but it might reflect how unproductive that person is in fact. By that I mean, suppose Bill and Mary each work on a task that is exactly the same and Bill does it in one hour and Mary completes it in two hours, who is most productive? You might say “the answer is obviously Bill and this will be reflected by him creating more work output in an 8 hour day.” But what if neither of them has any more work to do on a given day. Whose timesheet for that day would indicate higher productivity?
A more useful concept of productivity might be one that talks to value created from the customers’ perspective and value captured from the firm’s perspective. For example, we could say the firm described previously exhibited productivity of 55% that being the percentage of its capacity that actually yielded a profit.
If you would like to download and used the spreadsheet to analyze your own client base, contact me at ric.payne@principa.net.
An excellent analysis of a critical and widely underestimated issue for our industry. Does time-based billing actually serve any useful purpose? It is the measure of value of the service to the client that is a far better indicator of the “fit” of a client with a firm and thus the overall profitability. An excellent read, thanks Ric.