
Because industry structure plays a major part in determining the way in which competition plays out in an industry it’s useful to take a look at how structure changes over time due to forces coming from outside the industry (e.g. regulatory changes, technology impacts) as well as shifts in the way firms within the industry respond to those forces, innovate and compete.
The accounting services sector is a classic example of a highly fragmented, mature industry in which competition is intense that results in downward pressure on margins. Fragmented, mature industries typically have low barriers to entry, the barriers to exit are relatively high, growth in demand for the industry’s core product or service is slow, and the relative strength of customers and suppliers to the industry is high. Such industries are not particularly attractive in the sense that industry profitability, as measured by return on invested capital, is not high.
During the past 15-20 years there have been some huge changes impacting the accounting profession. I discussed these impacts earlier this year in a White Paper titled The Impact of the Changing Competitive Landscape on Strategy in Accounting Firms. In that paper I suggested that accounting services have become increasingly commoditized as a result of the driving force technology in particular has had on productization, transparency, team mobility and the increase in the degree of client sophistication.
It occurred to me that all of the changes that have taken place have probably changed the structure of the accounting profession so I thought I’d revisit a 1997 data set I used to write a White Paper on the emerging competitive landscape that I published in 2000 (based on the US 1997 Economic Census) and compare it with industry data from the most recent 2012 Economic census conducted by the US Census Bureau.
A complete analysis of the two data sets is available by clicking here if you’d like to peruse the analysis I have done. However, I thought I’d share a couple of tables in this post and offer a few tentative comments about what they tell us is happening in our profession.
Table 1
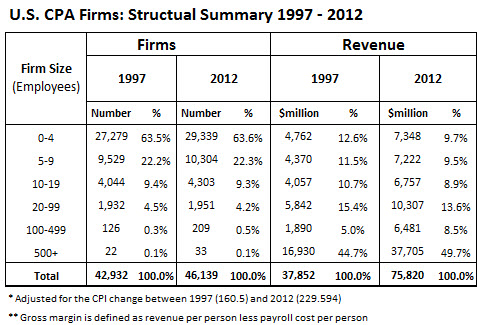
My analysis has only focused on CPA firms not the entire 54121 NAICS Code group which includes accounting (CPA offices and other Accounting Services), tax preparation, bookkeeping and payroll services. In total there were 112,517 firms in 2012 in the aggregate 54121 category of which there were 46,139 CPA firms (41%).
The above table indicates that industry structure when defined by the number of firms classified by number of employees has not changed in the 15 year period reviewed. If you define a small firm as being one with less than 10 employees you’ll notice they represented about 86% of all firms in both 1997 (36,808 firms) and 2012 (39,643 firms). In fact there’s been practically no change in the size distribution of any of the firm cohorts.
This is interesting because throughout that time we’ve been hearing about the intense M&A activity that is taking place in the profession. There is no question that is happening but it’s not changing the essential fragmented structure of the profession. I think the main reason for this is that every time there is merger or acquisition a handful of people do not “fit” and because they have limited alternative employment opportunities, or career aspirations, another one or two firms pop up.
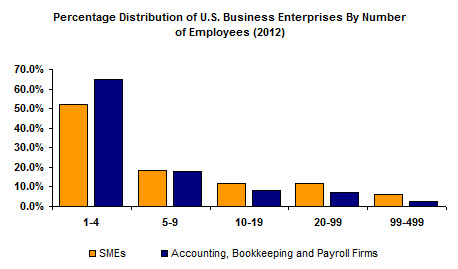
Another reason that I believe has merit is that as long as there a small businesses there will always be a natural demand for the services of small CPA firms that “look and feel” like their clients – refer to the remarkably similar pattern of size distribution for firms in the accounting services sector and all SMEs. Rightly or wrongly, these firms are also willing to keep their prices low to attract and retain customers – I happen to believe this is not a sound strategy but I also argue that if they’re not delivering real value to their customers then their prices will be low because at the end of the day market price does reflect value delivered.
Table 2
And that brings me to another observation from Table 1.
In 1997 industry revenue was in the order of $38 billion which had doubled to $76 billion by 2012. That’s a compound annual growth rate of 4.7% over the 15 year period which is not what I’d call stellar growth but is clearly indicative of what I’d expect for a mature industry. After adjusting for inflation using the CPI the annual compound real growth rate was only 2.3%.
One of the things that jumps out of Table 1 is the declining share of industry revenue that small firms (less than 10 employees) are receiving. This has fallen to 19.2% in 2012 from 24.1% in 1997. In other words small firms are getting a smaller share of the industry pie. The lion’s share of the increase in industry revenue is going to the big firms i.e. those with 100 or more team members.
I think there are several reasons for this. As I suggested above, small firms typically bid prices down to win and retain business. This is caused in part by them implementing productivity improving technologies that free up capacity that they fill with similar (low value) services and/or a productivity-driven cost saving is passed on to clients when they use time-based billing. They believe that the pursuit of best practice (as evidenced by the many benchmarking studies available) is the key to profit growth. This is clearly a necessary condition for survival but it is not a sufficient condition to gain competitive advantage simply because technology driven operational improvements disseminate rapidly which leads to competitive convergence.
In relation to my point on time-based billing, I have been told by many small practitioners who use time-based billing that they do not lower their fee compared with the previous year when they realize a productivity gain. However, the point they’re missing is that the rest of the industry is moving ahead with value added (and priced) services while they are holding their prices at previous levels at best while writing off cost over-runs to avoid disputes with many of their clients. The result is that small firms’ share of the industry revenue is diminishing.
But it gets worse for small firms.
Table 3
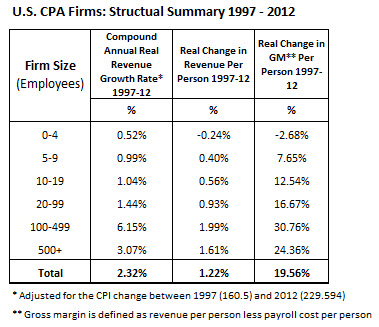
Table 3 reveals the real (CPI adjusted) changes, by firm size, in total revenue, revenue per person, and gross margin per person between 1997 and 2012. I have defined gross margin per person as being revenue per person less payroll per person for each of the size cohorts.
Here we see small firms having less than 1% growth in inflation-adjusted revenue, and for the very small firms there is evidence of a decline in both revenue per person and gross margin per person. The winners are again the very large firms which gives some weak support for the suggestion that there may be economies of scale in the industry but I suspect the main reason is, as suggested above, large firms deal with large clients who have both the ability and willingness to pay for high level services that small firms typically do not, or cannot, offer. In other words they serve a different market with a better value proposition.
As a general caveat to this analysis, it’s important to understand that while industry structure appears to be very stable it does not follow that the position of individual firms is also stable. Some firms move from one size cohort to the next and this happens in both directions. Those firms that design and implement good strategy inevitably increase in size and (hopefully) experience an improvement in revenue and profitability. Some of these firms become very large and very profitable.
At the same time some firms shrink as a consequence of failing to take note of what’s happening in their industry and their market. They lose talent, good clients, and the principals lose heart all of which leads to a negative spiral.
I should also point out that firm size as determined by the number of employees is not a good indicator of profitability where the latter is measured as net profit before owner compensation. There are some large firms that have way too many partners and very low team member to partner leverage. On the other hand, there are many small firms that exhibit very good leverage and that’s reflected in high profitability per partner. Having said that, however, firms with less than 5 people per partner are (generally) not going to be at the high end of profitability – the only exception being where the firm offers very high value (and priced) services to a small client niche.
It seems to me from this cursory analysis of the industry data that small firms are going to find it increasingly hard to keep up with the rest of the industry unless they can grow not by simply offering the same low value services to the same type of clients but by looking for ways to utilize technology to offer a higher value service proposition and price accordingly.
As the core accounting, tax and audit services continue to commoditize, margins will erode and only those firms that break out of the vortex of compliance will be the ones who prosper. This will call for a re-think of their business model which will include the market they wish to serve, the services they will offer that market, the technology they’ll use to deliver value, the alliances they will form to create and deliver, the pricing strategy they’ll employ, and the people they will employ. In short, what I’m saying here is they’ll need to radically re-think their entire modus operandi.